What IRR doesn't tell you
And why your actual return depends on what happened outside the fund.
My co-founder and I invested in the same fund. Same commitment, same cash flows, same quarterly reports. The fund shows a 23.4% IRR.
My actual return: 12.7%. His: 14.3%.
Neither of us was cheated. The fund's number is mathematically correct. The problem is that it's not our number. And for most LPs, it never is.
Here's why.
Start with something simple
You buy an asset for 100 and sell it later for 300. What's your multiple? In PE, this ratio of total value to paid-in capital is called the TVPI:
One investment, one exit value. The TVPI tells you how much money you made, but nothing about how long it took.
Selling at 300 in five years or ten years represents very different performance. Time matters. To capture it, we annualize the return into a compound annual growth rate (CAGR), where N is the number of years:
One investment, one gain, one duration. The CAGR is not debatable and tells you exactly what happened.
Now try to do the same with a private equity fund.
Funds have many cash flows
In a PE fund, you don't invest a lump sum. Capital is called in tranches over 4 to 5 years. And returns don't come back in one shot either: distributions trickle in over the fund's life. Here's what a typical top-quartile fund looks like:
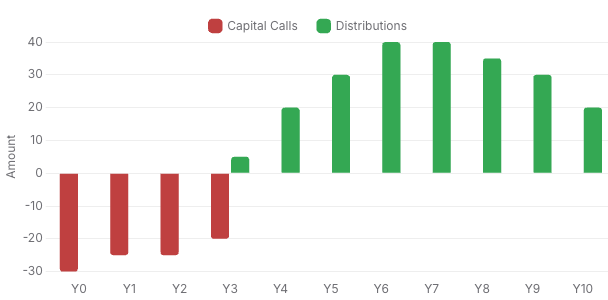
CAGR is no longer enough. Imagine two funds that both call 100 and return 300. Their CAGR will be identical. But if one fund distributes capital earlier, investors regain liquidity sooner and can redeploy it. The timing of cash flows changes the effective performance.
We'd like to get back to our familiar ratio - gains divided by investment - and annualize it. But with many cash flows scattered over a decade, we first need to collapse them into two numbers: a total investment figure and a total gains figure. To do that, we bring all calls back to one point in time (the start) and all distributions forward to another (the end). Calls are discounted using an uncalled capital return - what your capital earns while waiting to be called. Distributions are compounded using a reinvestment return - what you earn when you redeploy them. The result is the MIRR, a modified internal rate of return:
Three unknowns, one equation
Here's where it gets interesting. The MIRR formula has three rates: the overall return, the uncalled capital return, and the reinvestment return. IRR is silent on the last two — it doesn't tell you what your uncalled capital earns or where your distributions go. That silence has a mathematical cost. The only way to reproduce IRR through MIRR is to set both rates equal to the IRR itself. A 25% IRR only equals your actual return if everything around it was also compounding at 25%.
Mathematically, when all three rates are equal, the MIRR formula collapses to the standard IRR:
In other words, IRR measures what your capital earned while it was inside the fund — nothing more, nothing less. To know what happened to you as an LP, you need to account for what happened outside it.
The moment I understood this
After ten years in strategy consulting and an MBA, I had known the IRR formula for twenty years. It was a tool I used without questioning. But when we had to implement it in Clariteer, I wanted to truly understand the why behind the formula, not just the how.1
The implications are concrete. My co-founder Gregory and I both invested in the same fund, with the same commitment and the same cash flows. But we made different choices about our uncalled capital.
I put my unfunded commitment in a term deposit, earning about 2%. Gregory put his in an ETF, earning about 8% over the period. We both reinvest distributions into similar opportunities, so let's keep the reinvestment return at 7% for both of us.
This particular fund uses a credit line to bridge capital calls, so the actual calls to LPs come later than usual. The fund reports a 23.4% IRR. But when we each compute our return with our actual uncalled capital return (our MIRR), the picture changes:
Uncalled capital return
Reinvestment return
Result
Fund reported IRR
23.4% (implicit)
23.4% (implicit)
23.4%
Geoffroy's MIRR
2% (term deposit)
7%
12.7%
Gregory's MIRR
8% (ETF)
7%
14.3%
The GP can't calculate a personalized IRR for each LP. It depends on your context, your risk profile, your liquidity constraints. So the industry reports IRR — which only captures what happened inside the fund. The rest is yours to figure out.
I understand the logic. But the number on your quarterly report may not reflect your actual experience at all.
When does the gap matter?
Not always, and that's important to say upfront. If your uncalled capital and reinvestment returns are close to the fund's IRR, then your MIRR will also be close. Likewise, if capital is called early and distributed late, cash flows have little time to be discounted or compounded, so MIRR remains close to IRR.
On a classic J-curve fund with progressive exits, the gap is typically 3 to 5 percentage points. That may sound modest, but these are annualized rates that compound over 10 years. A 4-point difference on a 100 commitment means a meaningfully different outcome at maturity.
And there are fund profiles where the gap becomes very large:
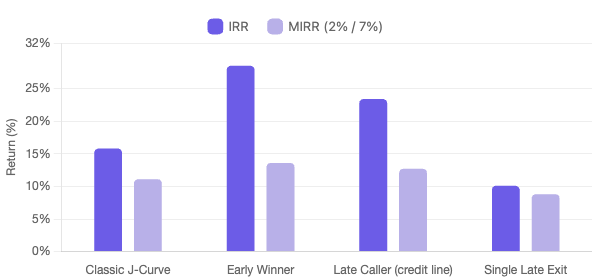
Profile
TVPI
IRR
MIRR (2%/7%)
Gap
Classic J-Curve
2.20x
15.8%
11.1%
4.7 pts
Early Winner
1.80x
28.5%
13.6%
14.9 pts
Late Caller (credit line)
2.20x
23.4%
12.7%
10.8 pts
Single Late Exit
2.00x
10.1%
8.8%
1.3 pts
Two patterns widen the gap. First, large early distributions: when a fund has a significant exit in years 2 or 3, the IRR gets locked in early at a high level, and the reinvestment assumption has maximum time to compound. Second, delayed capital calls: when a GP uses a subscription line of credit, the calls are pushed back by 12 to 18 months. The fund appears to have generated the same returns in less time, while your capital was probably sitting in cash all along.
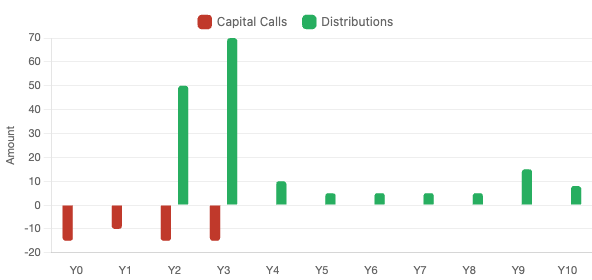
Conversely, a fund with a single late exit and no intermediate distributions shows almost no gap, because there is very little reinvestment to assume in the first place.
What you can do about it
IRR does what it does well: it measures the time-value performance of a fund's cash flows. But if you want to know your actual return as an LP, you need two more inputs: what your uncalled capital earned, and where your distributions went. Without those, the number on your quarterly report may tell a very different story from your real experience.
Know your own rates. What does it cost you to hold uncalled capital? Where do your distributions go when they come back? These two numbers are personal, and they change everything. Even a rough estimate gives you a much clearer picture than the standard IRR.
Ask for the cash flows. DPI and TVPI are useful summaries, but the real information is in the timing and magnitude of each call and distribution. With the detailed flows, you can compute your own MIRR.
Compare IRR and MIRR side by side. If they're close (1 to 2 points), the standard IRR is a reasonable approximation. If the gap is 5 points or more, something in the fund's cash flow profile is amplifying the distortion, and it's worth understanding why.
Use cash flow predictions to manage the gap. Much of the IRR-MIRR differential comes from unproductive periods - capital sitting idle before calls, or distributions waiting to be redeployed. Forecasting upcoming cash flows lets you tighten those windows and reduce the drag on your actual returns.
I was invited by the Finscale podcast to discuss fund reporting in general and IRR in particular together with Emmanuel Delaveau from Partech and Ludovic Phalippou from Oxford University. Read the article and watch the video here.


We regularly write about private equity
Be notified when a new article is published.
No spam, no sequences. Unsubscribe anytime.